%matplotlib inline
import numpy as np
from matplotlib import pyplot as plt
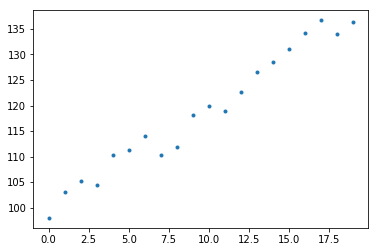
size = 20
x = np.arange(size)
y = 100.0 + 2.0 * x + np.random.normal(scale=2, size=size)
plt.plot(x, y, '.');
def to_matrix(x):
"""对每条数据补充 x0 = 1,返回 x 矩阵及数据个数"""
m = x.shape[0]
x_mat = np.array([np.ones(m), x]).T
return x_mat, m
def compute_cost(x, y, theta):
xx, m = to_matrix(x)
return 0.5 * m * ((xx.dot(theta) - y)**2).sum()
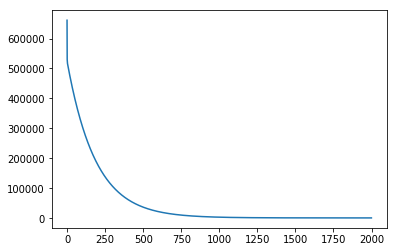
def gradient_descent(x, y, theta, alpha, iternum):
"""实施梯度下降法
theta: 参数向量
alpha: learning rate
iternum: 迭代次数
"""
cost_history = []
xx, m = to_matrix(x)
for i in range(iternum):
gradient = xx.T.dot(xx.dot(theta) - y)
theta = theta - alpha / m * gradient
cost_history.append(compute_cost(x, y, theta))
return theta, cost_history
theta = np.array([0., 0.])
theta, cost_history = gradient_descent(x, y, theta, 0.01, 2000)
plt.plot(cost_history);
label = 'y = {:.3f} + {:.3f} * x'.format(*theta)
plt.plot(x, y, '.')
plt.plot(x, theta[0] + theta[1] * x, label=label)
plt.legend();

from numpy.linalg import pinv
X = to_matrix(x)[0]
theta2 = pinv(X.T.dot(X)).dot(X.T).dot(y)
theta2
array([ 99.66043542, 2.01111133])